The Prevalence Rate for Attention deficit hyperactivity Disorder Adhd Continues to
GLOBAL
A meta-analysis of 175 research studies worldwide on ADHD prevalence in children aged 18 and under found an overall pooled estimate of 7.2% (Thomas et al. 2015). The US Census Bureau estimates 1,795,734,009 people were aged 5-19 worldwide in 2013. Thus, 7.2% of this total population is 129 million—a rough estimate of the number of children worldwide who have ADHD.
Based on DSM-IV screening of 11,422 adults for ADHD in 10 countries in the Americas, Europe and the Middle East, the estimates of worldwide adult ADHD prevalence averaged 3.4% (Fayyad et al. 2007)
UNITED STATES
Children & Adolescents
According to analysis of data collected by the National Health Interview Survey (NHIS), the prevalence rates of diagnosed ADHD among children and adolescents aged 4 to 17 in the past twenty years are as follows (Xu et al, 2018):
Overall prevalence and by age group (percent)
| Year | Overall | Ages 4-11 | Ages 12-17 |
| 2015-2016 | 10.2 | 7.7 | 13.5 |
| 2013-2014 | 9.4 | 7.9 | 11.3 |
| 2011-2012 | 9.6 | 7.7 | 12.0 |
| 2009-2010 | 9.0 | 6.9 | 11.9 |
| 2007-2008 | 8.1 | 6.1 | 10.8 |
| 2005-2006 | 7.5 | 6.0 | 9.3 |
| 2003-2004 | 7.3 | 5.8 | 9.3 |
| 2001-2002 | 7.2 | 5.9 | 8.9 |
| 1999-2000 | 6.5 | 5.3 | 8.2 |
| 1997-1998 | 6.1 | 5.3 | 7.2 |
Prevalence by gender (percent)
| Year | Boys | Girls |
| 2015-2016 | 14.0 | 6.3 |
| 2013-2014 | 12.8 | 5.8 |
| 2011-2012 | 13.6 | 5.4 |
| 2009-2010 | 12.2 | 5.7 |
| 2007-2008 | 11.3 | 4.8 |
| 2005-2006 | 10.6 | 4.2 |
| 2003-2004 | 10.2 | 4.3 |
| 2001-2002 | 10.3 | 4.0 |
| 1999-2000 | 9.4 | 3.4 |
| 1997-1998 | 9.0 | 3.1 |
Prevalence by race/ethnicity (percent)
| Year | Hispanic | Non-Hispanic white | Non-Hispanic black | Other |
| 2015-2016 | 6.1 | 12.0 | 12.8 | 7.7 |
| 2013-2014 | 6.1 | 11.4 | 8.8 | 6.9 |
| 2011-2012 | 6.1 | 11.6 | 9.4 | 6.9 |
| 2009-2010 | 4.8 | 10.6 | 11.1 | 6.2 |
| 2007-2008 | 4.4 | 9.6 | 8.5 | 6.0 |
| 2005-2006 | 5.1 | 8.5 | 7.5 | 5.1 |
| 2003-2004 | 4.1 | 8.6 | 7.3 | 5.2 |
| 2001-2002 | 3.8 | 8.4 | 7.2 | 3.7 |
| 1999-2000 | 3.4 | 7.8 | 4.8 | 4.0 |
| 1997-1998 | 3.6 | 7.2 | 4.7 | 3.9 |
The2016 National Survey of Children's Health (NSCH) interviewed parents and reports the following ADHD prevalence data among children ages 2–17 (Danielson et al. 2018):
- 6.1 million children (9.4 percent) haveever been diagnosed with ADHD. This includes:
- About 388,000 young children ages 2-5 (or 2.4 percent in this age group)
- 2.4 million school-age children ages 6-11 (or 9.6 percent in this age group)
- 3.3 million adolescents ages 12-17 (or 13.6 percent in this age group)
- 5.4 million children (8.4 percent) have acurrent diagnosis of ADHD. This includes:
- About 335,000 young children ages 2-5 (or 2.1 percent in this age group)
- 2.2 million school-age children ages 6-11 (or 8.9 percent in this age group)
- 2.9 million adolescents ages 12-17 (or 11.9 percent in this age group)
- Treatment used by children ages 2-7 with acurrent diagnosis of ADHD:
- Two out three were taking medication (62 percent).
- Less than half received behavioral treatment in the past year (46.7 percent).
- Nearly one out of three received a combination of medication and behavioral treatment in the past year (31.7 percent).
- Nearly one out of four had not received any treatment (23 percent).
- Severity of ADHD among children ages 2-17:
- 14.5 percent had severe ADHD
- 43.7 percent had moderate ADHD
- 41.8 percent had mild ADHD
- Co-occuring conditions (children ages 2-17):
- Two out of three children (63.8 percent) had at least one co-occuring condition.
- Half of all children (51.5 percent) had behavioral or conduct problems.
- One out of three children (32.7 percent) had anxiety problems.
- One out of six children (16.8 perccent) had depression.
- About one out of seven children (13.7 percent) had autism spectrum disorder.
- About one out of 80 children (1.2 percent) had Tourette syndrome.
- One in a hundred adolescents (1 percent) had a substance abuse disorder.
- By race or ethnicity (children ages 2-17):
- 8.4 percent White
- 10.7 percent Black
- 6.6 percent Other
- 6.0 percent Hispanic/Latino
- 9.1 percent Non-Hispanic/Latino
Analysis of parent-reported data from theNational Health Interview Survey (NHIS) 2011–2013 found the following (Pastor et al. 2015):
- 9.5% of children ages 4–17 years were ever diagnosed with ADHD
- By age groups:
- 2.7% of children ages 4–5
- 9.5% of children ages 6–11
- 11.8% of children ages 12–17
- By gender:
- 13.3% of boys
- 5.6% of girls
- By race/ethnicity:
- 11.5% non-Hispanic white children
- 8.9% non-Hispanic black children
- 6.3% Hispanic children
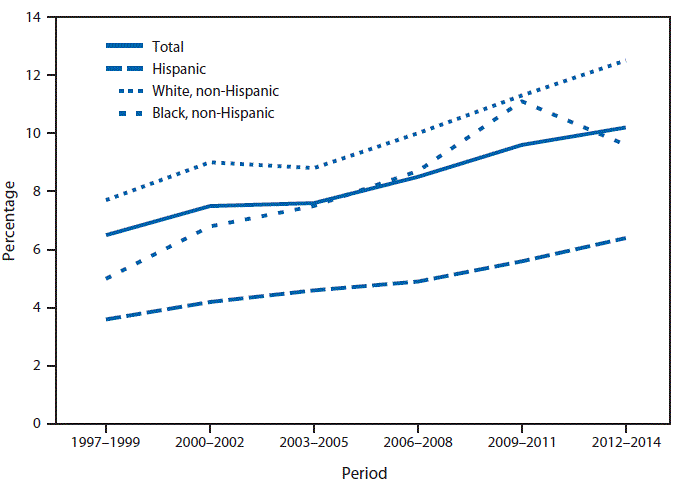
The same study found the rate of ADHD diagnosis increased from 7.0% in 1997–1999 to 10.2% in 2012–2014. During this period, prevalence increased among non-Hispanic white children from 8.5% to 12.5%, among non-Hispanic black children from 5.5% to 9.6%, and among Hispanic children from 3.8% to 6.4%.

TheNational Survey of Children's Health (NSCH) 2003–2011—based on parent interviews—highlights the following data for children aged 4–17 (US CDC 2014):

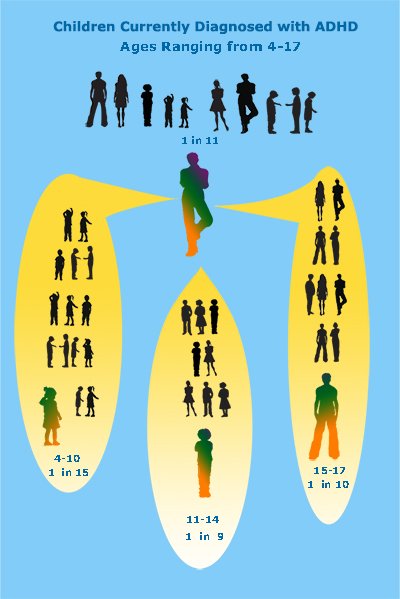
- 5.1 million children (8.8% or 1 in 11 of this age group 4–17 years) have a current diagnosis of ADHD:
- 6.8% of children ages 4–10 (1 in 15)
- 11.4% of children ages 11–14 (1 in 9)
- 10.2% of children ages 15–17 (1 in 10)
- The average age of current ADHD diagnosis was 6.2 years, including:
- "Mild" ADHD diagnosed at 7 years,
- "Moderate" ADHD diagnosed at 6.1 years, and
- "Severe" ADHD diagnosed at 4.4 years.
- 3.5 million children (69% of children with current ADHD) were taking medication for ADHD.
- Boys (12.1%) continue to be more than twice as likely than girls (5.5%) to have current ADHD.
- Current ADHD prevalence rates vary between states, with Nevada having the lowest rate at 4.2% and Kentucky having the highest rate of 14.8%.
- According to the parent reports, 6.4 million children (11% of this age group 4–17 years) have ever been diagnosed with ADHD, and rates of ever-diagnosed ADHD increased an average of approximately 5% per year from 2003 to 2011.
US States
- ADHD – Where Children Live Might Make a Difference for Diagnosis and Treatment
- State-based Prevalence Data of Parent Reported ADHD Diagnosis by a Health Care Provider, 2016-2019
- State Profiles of Parent Reported ADHD Medication Treatment
Children in Elementary School
According to a recent population-based study using DSM-IV criteria, 15.5% of school children enrolled in Grades 1 to 5 have ADHD. The study combined the results of rating scales filled out by teachers and telephone interviews of parents for 7,847 children (Rowland et al. 2015).
Adults
According to a screen for ADHD in 3,199 adults aged 18–44 from theNational Comorbidity Survey Replication (NCS-R), 4.4% of US adults have ADHD. Of these adults with ADHD, 38% are women and 62% are men (Kessler et al. 2006).
A systematic review and meta-analysis of 14 studies that included over 9,400 adult attendees in psychiatric outpatient clinics shows high rates of adult ADHD. The pooled prevalence of ADHD was about 15% in the five studies using a two-stage design and about 27% in the nine screening studies. The study was published in the Journal of Attention Disorders (Adamis et al. 2022).
References
Adamis, Dimitrios et al. (April 2022). ADHD in Adults: A Systematic Review and Meta-Analysis of Prevalence Studies in Outpatient Psychiatric Clinics. Journal of Attention Disorders.
Danielson, Melissa et al. (January 2018). Prevalence of Parent-Reported ADHD Diagnosis and Associated Treatment Among U.S. Children and Adolescents, 2016.Journal of Clinical Child & Adolescent Psychology.
Fayyad J. et al. (May 2007). Cross-national prevalence and correlates of adult attention-deficit hyperactivity disorder.British Journal of Psychiatry, 190(5):402–409.
Kessler, Ronald C. et al. (April 2006). The Prevalence and Correlates of Adult ADHD in the United States: Results From the National Comorbidity Survey Replication,American Journal of Psychiatry 163(5):71.
Pastor, Patricia N. (August 28, 2015). QuickStats: Percentage of Children and Adolescents Aged 5–17 Years with Diagnosed Attention-Deficit/Hyperactivity Disorder (ADHD), by Race and Hispanic Ethnicity — National Health Interview Survey, United States, 1997–2014,Morbidity and Mortality Weekly Report (MMWR)64(33):925–925.
Pastor, Patricia N. et al. (2015). Association between diagnosed ADHD and selected characteristics among children aged 4–17 years: United States, 2011–2013.NCHS data brief, no 201. Hyattsville, MD: National Center for Health Statistics.
Rowland, Andrew et al. (September 2015). The Prevalence of ADHD in a Population-Based Sample.Journal of Attention Disorders v19(9):741–754.
Thomas, Rae et al. (April 2015). Prevalence of Attention-Deficit/Hyperactivity Disorder: A Systematic Review and Meta-analysis.Pediatrics, 135(4), pp. e994–e1001.
U.S. Centers for Disease Control and Prevention (2014). Key Findings: Trends in the Parent-Report of Health Care Provider-Diagnosis and Medication Treatment for ADHD: United States, 2003–2011.
US. Census Bureau, Population Division. World Midyear Population by Age and Sex for 2013
Xu, Guifeng et al. (August 2018). Twenty-Year Trends in Diagnosed Attention-Deficit/Hyperactivity Disorder Among US Children and Adolescents, 1997-2016. JAMA Network Open. 2018;1(4):e181471.
Source: https://chadd.org/about-adhd/general-prevalence/
0 Response to "The Prevalence Rate for Attention deficit hyperactivity Disorder Adhd Continues to"
Post a Comment